
Description
Opacity is one of the biggest challenges in machine learning/deep learning solutions in the real world. Any basic deep learning model can contain dozens of hidden layers and millions of neurons interacting with each other. Explaining the Deep Learning model solutions can be a bit challenging. Our proposal explain some Approaches that can help to make ML/DL models more interpretable.
Model Interpretability Background
Data Science/AI models are still often perceived as a black box capable of performing magic. As we are solving more complex problems using advanced algorithms, the situation is such that more sophisticated the model, lower is the explainability level.
Without a reasonable understanding of how DS/AI model works, real-world projects rarely succeed. Also, business may not know the intricate details of how a model might work and as model will be making a lot of decisions for them in the end, they do have a right to pose the question.
A lot of real-world scenarios where biased models might have really adverse effects e.g. predicting potential criminals (https://www.propublica.org/article/machine-bias-risk-assessments-in-criminal- sentencing), judicial sentencing risk scores (https://www.propublica.org/article/making-algorithms-accountable), credit scoring, fraud detection, health assessment, loan lending, self-driving.
Many researchers are actively working on making DS/AI models interpretable (Skater, ELI5, SHAP etc).
Why Model Interpretability is important?
DS/AI models are used to make critical decisions on behalf of business. For the decisions taken by DS/AI models, business needs to cover these three aspects as well:
- Fairness - How fair are the predictions? What drives model predictions?
- Accountability - Why did the model take a certain decision?
- Transparency - How can we trust model predictions?
How to make models interpretable?
In order to make models interpretable, following approaches/techniques can be used:
- Feature Importance
- Partial Dependence Plot
- SHAP Values
- LIME
- Skater
Lets have a look at these approaches/techniques one by one:
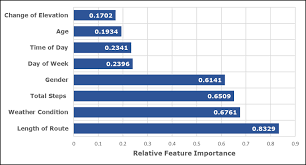
1. Feature Importance
For Machine Learning Models like XGBoost, Random Forest, Machine Learning Feature Importance helps Business Analysts drive Logical Conclusion out of it.
We measure the importance of a feature by calculating the increase in the model’s prediction error after permuting the feature. A feature is “important” if shuffling its values increases the model error, because in this case the model relied on the feature for the prediction. A feature is “unimportant” if shuffling its values leaves the model error unchanged, because in this case the model ignored the feature for the prediction.
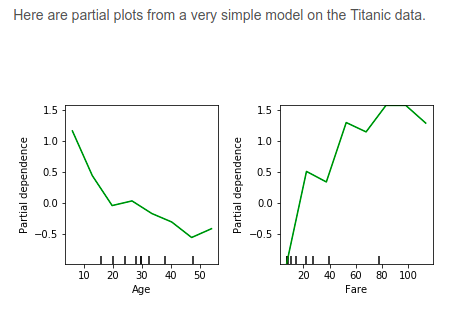
2. Partial Dependence Plot
Partial dependence plots show how a feature affects predictions. Partial dependence plots (PDP) show the dependence between the target response and a set of ‘target’ features, marginalizing over the values of all other features (the ‘complement’ features). Intuitively, we can interpret the partial dependence as the expected target response as a function of the ‘target’ features.
3. SHAP (SHapley Additive exPlanations) Values
SHAP Values break down a prediction to show the impact of each feature. These are the scenarios where we need this technique:
- A model says a bank shouldn't loan someone money, and the bank is legally required to explain the basis for each loan rejection
- A healthcare provider wants to identify what factors are driving each patient's risk of some disease so they can directly address those risk factors with targeted health interventions.

We predicted 0.7, whereas the base_value is 0.4979. Feature values causing increased predictions are in pink, and their visual size shows the magnitude of the feature's effect. Feature values decreasing the prediction are in blue. The biggest impact comes from Goal Scored being 2. Though the ball possession value has a meaningful effect decreasing the prediction.
The SHAP package has explainers for every type of model. - shap.DeepExplainer works with Deep Learning models. - shap.KernelExplainer works with all models, though it is slower than other Explainers and it offers an approximation rather than exact Shap values.
4. LIME (Local Interpretable Model-Agnostic Explanations)
LIME (https://github.com/marcotcr/lime) can be used on anything from a polynomial regression model to a deep neural network.
LIME’s approach is to perturb most of the features of a single prediction instance — essentially zeroing-out these features — and then to test the resulting output. By running this process repeatedly, LIME is able to determine a linear decision boundary for each feature indicating its predictive importance (e.g. which pixels contributed the most to the classification of a specific image).
Interpretation of Lime :--
- Local - Local refers to local fidelity - i.e., we want the explanation to really reflect the behaviour of the classifier "around" the instance being predicted.
- Interpretable - Lime explain output of Classifiers which are interpretable by humans. For e.g. Representing words for a Model which is built on word embeddings.
- Model Agnostic - Lime is able to explain a Machine Learning Model without understanding it in deep.
- Explanation - Lime explanations are not too long so that it is difficult for Humans to understand it.


5. Skater
Skater is a Python library designed to demystify the inner workings of complex or black-box models. Skater uses a number of techniques, including partial dependence plots and local interpretable model agnostic explanation (LIME), to clarify the relationships between the data a model receives and the outputs it produces.